Evaluating indicators
Among the selected parameters the ratio of rural to the urban population directly relates to the per capita renewable water, whereas the population density, internet users, and education index exhibit an inverse relation with the per capita renewable water worldwide. It means the per capita renewable water decreases with decreasing rural to urban population and increasing population density, internet users, and education index. The urban population has increased in developing regions, which feature increasing population density. People’s health is threatened by poor urban sanitary infrastructure leading to disease and social decay. Increasing population density and a reduction in per capita renewable water inflict social harm and disrupt society’s economic growth58. Population density also is positively related to the relative number of elderly and social vulnerability because potential casualties increase with population size40. On the other hand, with the increase of Internet users and education index, the per capita renewable water has increased. As long as the knowledge and awareness of communities improved, the consumption algorithm decreased, leading to a reduction of renewable water per capita. Therefore, the level of literacy and knowledge for a community can be the basis for making the right decisions in agriculture, health, natural resource management, and other activities related to water resources for decision-makers. The latter situation calls for better communication among water users through social media and improved education to learn and develop optimal water management.
Evaluating models and developing hydro-social equations
Three soft-computing approaches, namely ANN-LM, ANFIS-SC, and GEP, were applied to develop predictive equations with social indicators worldwide. The ANN-Levenberg–Marquardt (LM) backpropagation algorithm with one hidden layer was applied, and the hidden nodes’ number was determined by trial and error. A hybrid algorithm was combined with the ANFIS-SC models. There is no rule for determining the radii values of the ANFIS-SC models. The final radii values were determined by trial-and-error.
The numbers of neurons in the ANN-LM models and the radii values of the ANFIS-SC models are listed in Table 4. The activation functions of the output nodes were linear for all the continents. The activation functions of the hidden nodes of the ANN-LM models for the P1 through P4 indicators were respectively the tangent sigmoid, tangent sigmoid, tangent sigmoid, and logarithm sigmoid for Africa; the activation functions of the proportion of rural to urban population was the tangent sigmoid for all the continents. Table 5 lists the results of the soft computing optimal models’ estimates of the proportion of rural to urban population (PRUP), population density (PD), internet users (IU), and education index (EI), denoted respectively by P1 through P4, during the test period in the world’s continents. Figures 4 and 5 display the characteristics of ANN (the number of neurons and activation functions of hidden and output layers) and ANFIS-SC (radii values) models, respectively. The values of R and RMSE for Africa corresponding to the ANN-LM models were respectively (0.921, 0.981, 0.858, 0.862) and (0.193, 0.058, 0.190, 0.172) associated with the PRUP, PD, IU, and EI parameters, respectively. The values of R and RMSE for Africa corresponding to the ANFIS-SC models equaled respectively (0.933, 0.991, 0.868, 0.891) and (0.130, 0.044, 0.186, 0.156) for the P1 through P4 parameters, respectively. Concerning the GEP models, the root relative squared error (RRSE) was selected as the pressure tree’s fitness function. The values of RMSE for GEP models equaled (0.084, 0.029, 0.178, 0.135), (0.197, 0.056, 0.152, 0.163), (0.151, 0.036, 0.123, 0.210), (0.182, 0.039, 0.148, 0.204) and (0.141, 0.030, 0.226, 0.082) for Africa, America, Asia, Europe, and Oceania, respectively. Table 5 results for the R, RMSE, and MAE values establish the GEP model estimates of PRUP, PD, IU, and EI indicators had the highest R values and the lowest RMSE values. The average R values of the best models (GEP) for all selected social parameters equaled 0.942, 0.909, 0.910, 0.889, and 0.947 for Africa, America, Asia, Europe, and Oceania, respectively. These results indicate the climatic characteristics of the continents influence the performance of the models. The models’ performances for Africa and Oceania associated with the type B dominant Koppen climate classification was the best. The models’ performances for Asia and America that have similar climatic classification were nearly equal. The average model performance for Europe in the type D climate classification was the poorest among the continents.
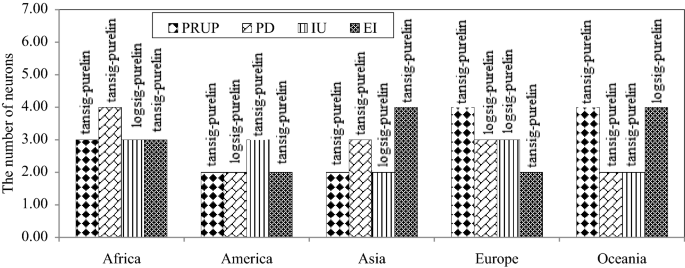
The characteristics of optimal ANN models; showing the number of neurons and activation functions of hidden and output layers.
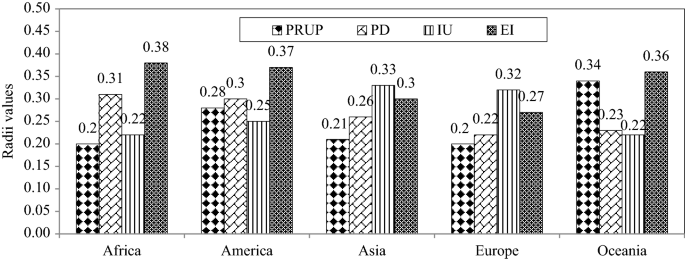
The characteristic of optimal ANFIS-SC model showing the radii values.
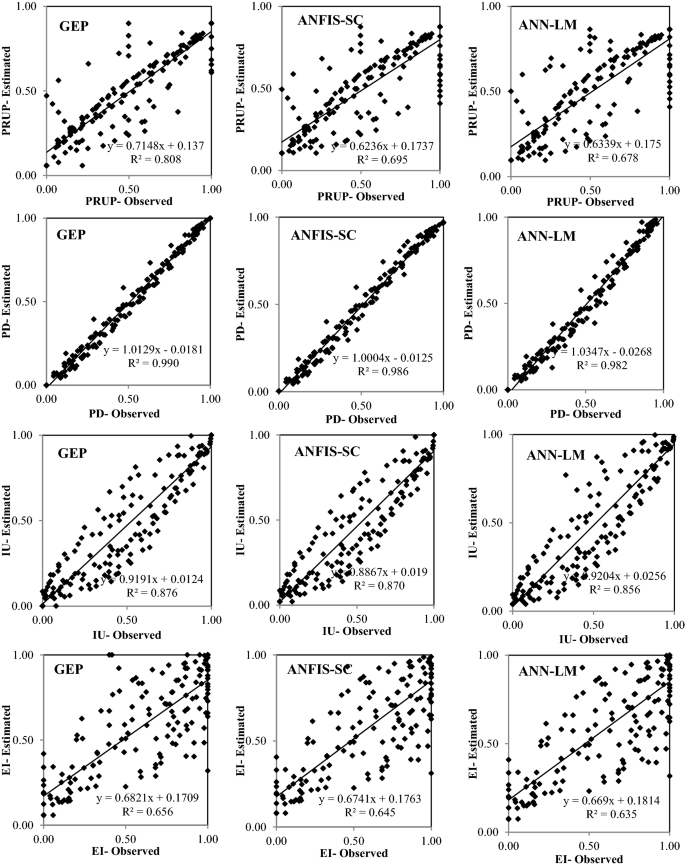
Figures 6, 7, 8, 9 and 10 show the observed and estimated social parameters obtained with the soft-computing models during the test period in Africa, America, Asia, Europe, and Oceania, respectively. Figure 11 compares the R, RMSE, and MAE values from the soft-computing models. The R values for soft-computing models are close to 1, with the quality relations being: RGEP > RANFIS-SC > RANN-LM for all social indicators. Figure 11 establishes that the ANFIS-SC model exceeded the ANN-LM models’ performance. Also, the GEP models had better performance than the ANFIS-SC and ANN-LM for estimating the proportion of rural to urban population (PRUP), population density (PD), internet users (IU), and education index (EI) parameters in Africa, America, Asia, Europe, and Oceania.
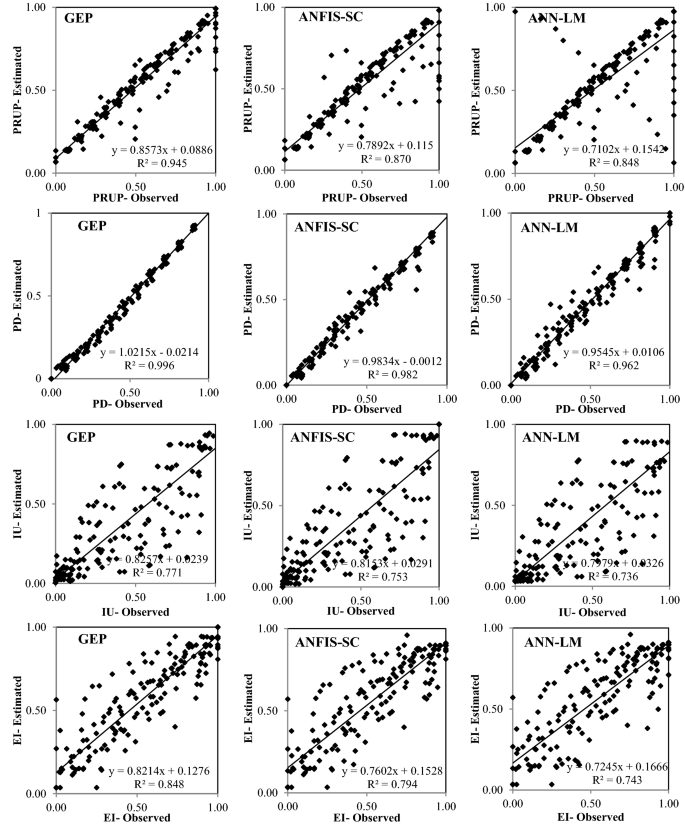
Observed and estimated social parameters during the testing period in Africa.
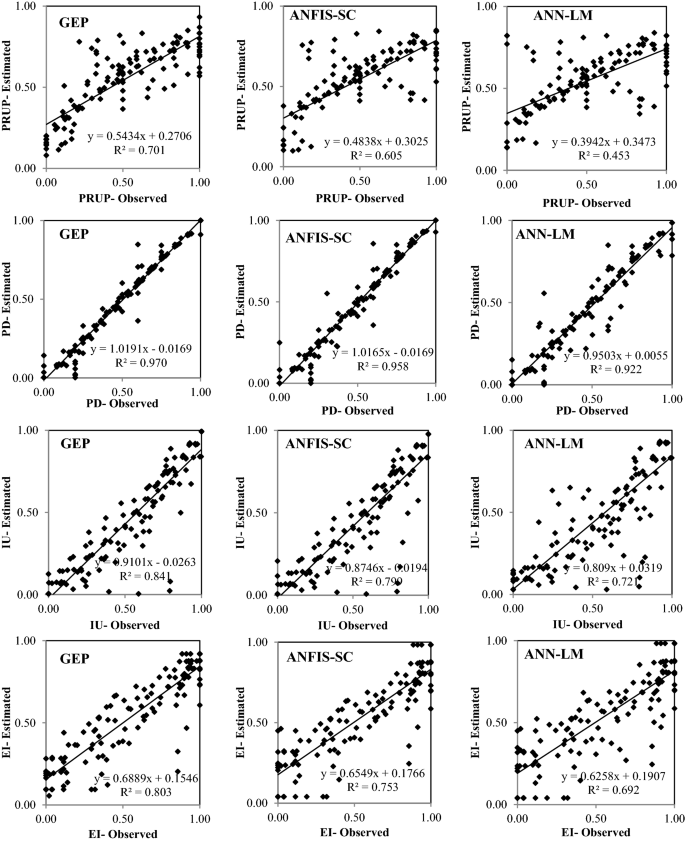
Observed and estimated social parameters during the testing period in America.
Observed and estimated social parameters during the testing period in Asia.
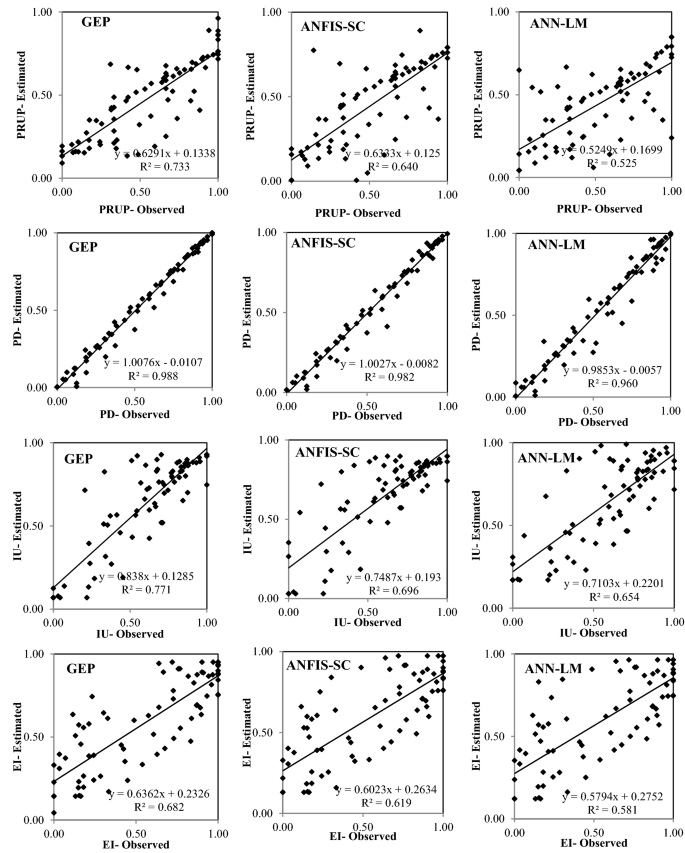
Observed and estimated social parameters during the testing period in Europe.
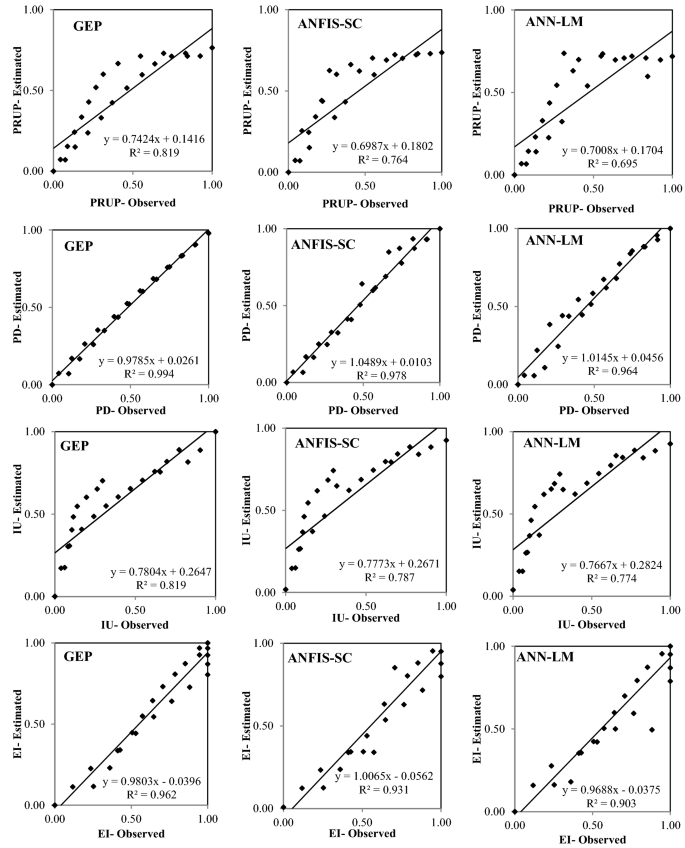
Observed and estimated social indicators during the testing period in Oceania.
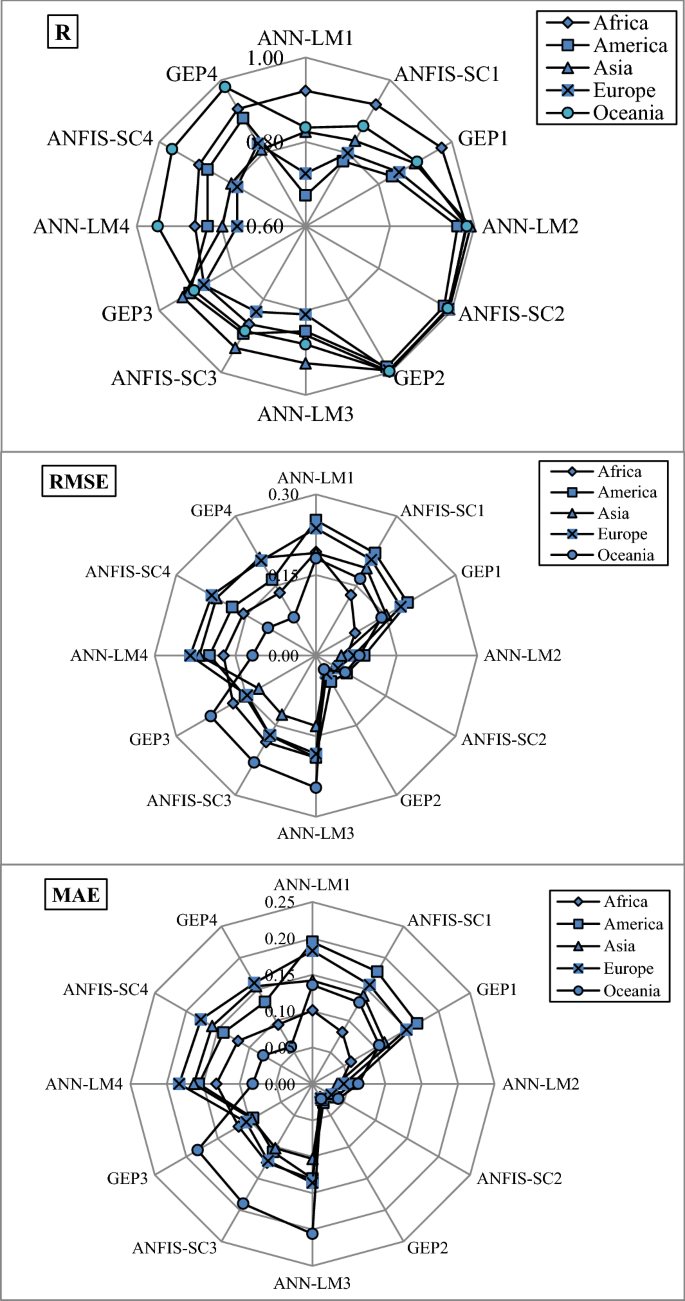
Comparison of R, RMSE and MAE values corresponding to the soft computing methods.
The main advantage of the GEP over other soft computing methods (e.g., ANFIS and ANN) is in producing predictive equations. The equations obtained with the optimal models for the social indicators (i.e., the proportion of rural to urban population (PRUP), population density (PD), internet users (IU), and education index (EI) in Africa, America, Asia, Europe, and Oceania) are listed in Table 6. The equations that the GEP model discovers as a structure do not necessarily correspond to reality. The equations listed in Table 6 merely show the optimal equations extracted from the model after the evolution, for all indicators and in all basins (considering renewable water per capita as a decision variable).
The performance of the GEP models in estimating the social indicators in three ranges of values, namely, 20% of the maximum estimated values (20%max), 60% of median estimated values (60%mid or 20%min to 20%max), and 20% of minimum estimated values (20%min), during the test period for the proportion of rural to urban population (PRUP), population density (PD), internet users (IU) and the education index (EI) parameters of Africa, America, Asia, Europe, and Oceania are listed in Table 7. Table 7’s results indicate there is not a regular rule to determine the best-cited ranges performances. The education index and the population density have the lowest and highest R values among the other parameters in the three different ranges (20%max, 60%mid, and 20%min) in Africa, America, Asia, Europe, and Oceania. Therefore, the results indicate a strong pattern of association between the population density parameter and water resources status in all continents of the world.
Figure 12 depicts the distribution of estimated data values of the social parameters (i = 1, 2, 3, 4) and their comparison through the continents. The box plots are a graphic display integrating multiple numerical relations. One approach to understanding the distribution or dispersion of data is through the box diagram, which is based on the “minimum,” “first quartile-Q1(0.25%)”, “median (0.50%)”, “third quartile-Q3(0.75%)” and “maximum” statistical indicators. Figure 12 shows Oceania and Africa exhibit the smallest and largest values of the rural to urban population, respectively. America has the lowest values of the first to the third quartile. The estimated population density value in Europe has the most values in the third quartile (0.75%). The median values of estimated internet users have the smallest and largest values in Africa and Europe, respectively. America has the lowest values of the first quartile, median, third quartile, and maximum values associated with the estimated education index values among the continents.
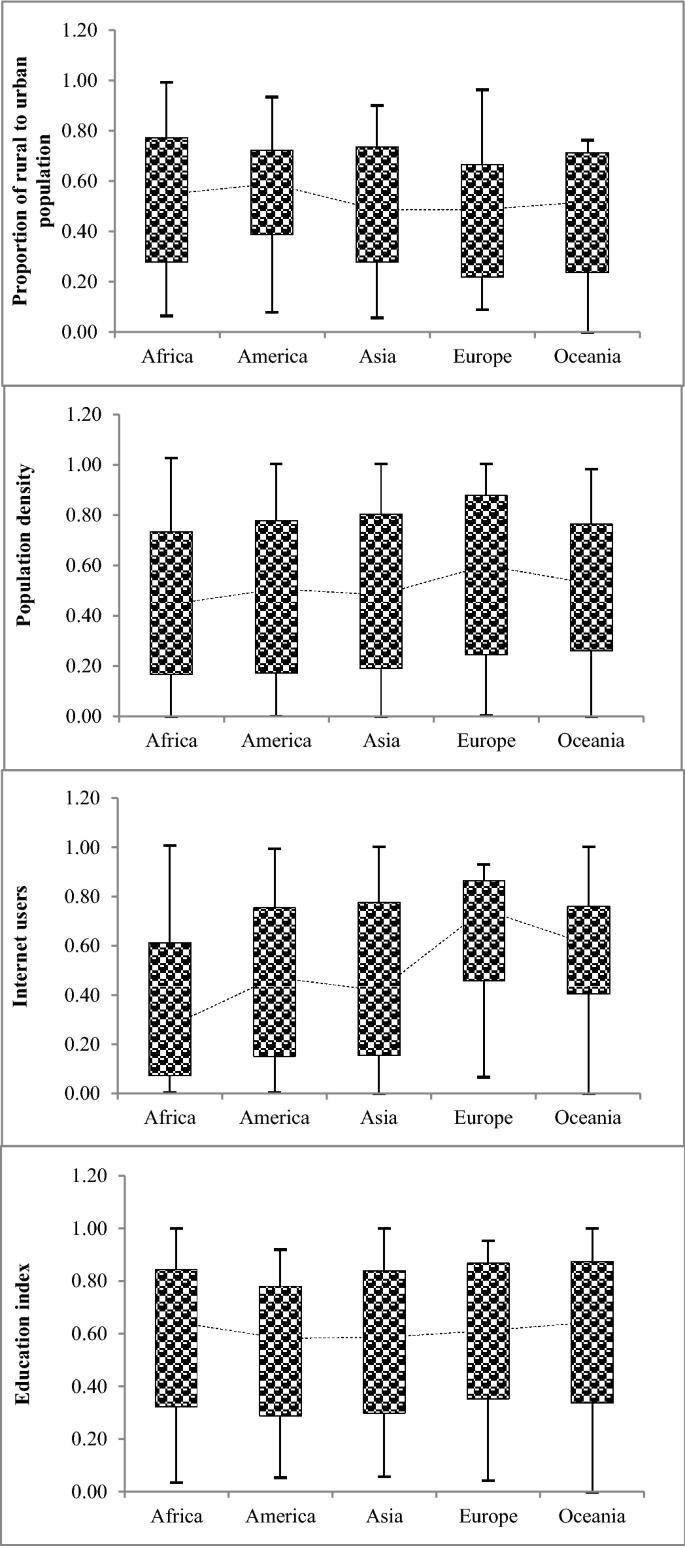
Distribution of estimated data values of social indicators (Pi, i = 1, 2, …, 4).
The summary of hydro-social equations performance is listed in Table 8, where it is seen the best models’, performances are such that PD > PRUP > EI > IU, PD > IU > EI > PRUP, PD > IU > PRUP > EI, PD > PRUP > IU > EI and PD > EI > IU > PRUP for Africa, America, Asia, Europe, and Oceania, respectively.
This paper’s results indicate the pattern of association between social parameters and water resources is complex. Renewable water per capita was estimated using social indicators PRUP, PD, IU, and EI based on gene expression programming. The results of GEP to estimate RWPC corresponding to the testing period in the world’s continents as listed in Table 9. The values of RMSE for optimal GEP models equaled 0.089, 0.058, 0.042, 0.049, and 0.036 for Africa, America, Asia, Europe, and Oceania, respectively. Figure 13 displays the observed and estimated RWPC parameter during the test period in the world’s continents. The equations obtained with the optimal models for the renewable water per capita in Africa, America, Asia, Europe, and Oceania are listed in Table 10. The fitted equations can be applied at variable spatial and temporal scales. The derived equations imply that water resources in Africa and Oceania are governed by the PRUP, PD, IU, and EI indicators. Also, the PRUP, PD, and IU indicators in Europe and PD and IU indicators in America and Asia have the most influence on their water resources status. The association between social parameters and water resources in all continents is variable. The linking of these social indicators with the per capita renewable water is a function of the countries’ cultural and economic conditions, thus bearing on the future management and policymaking across continents. This study’s results concerning hydro-social indicators are consistent with the findings by Forouzani et al.2, Carey et al.15, Lima et al.25, Pande et al.7, Diep et al.26, and Diaz et al.22.
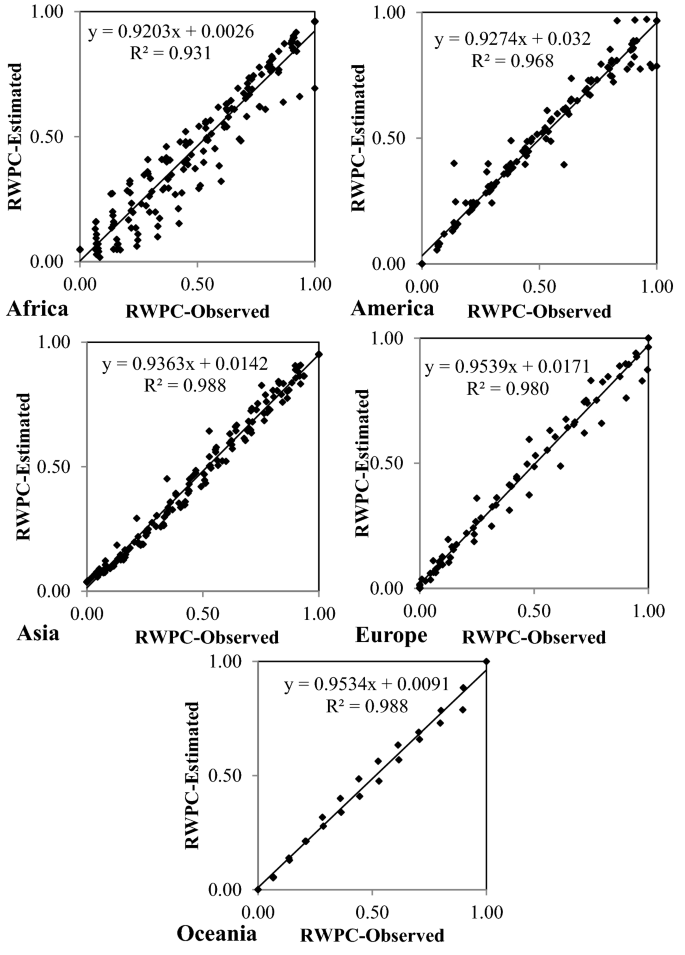
Observed and estimated RWPC parameters during the test period in the world’s continents.
This paper’s results establish the importance of examining the interactions between climate, the status of water resources, and social indicators. The state and social conditions of a country reflect the status of its water resources. Therefore, this study has shown how significant an impact the management and planning of a country can have on its water resources. Each successful water resources project rests on a successful social setting.


More Stories
How Social Sciences Shape Our Modern World
Why Social Sciences Matter More Than Ever
The Hidden Power of Social Sciences in Policy Making